We aim to make our website as accessible as possible. However if you use a screen reader and require debt advice you may find it easier to phone us instead. Our phone number is 0 8 0 0 1 3 8 1 1 1 1. Freephone (including all mobiles).

Who experiences coerced debt and who are the perpetrators?  

  Download the report

Please note: the following contains details of domestic abuse, including violence, and mentions of suicidal ideation, self-harm and suicide attempts, which some readers may find distressing.

To compare experiences between different groups who had experienced coerced debt, we focused on the following questions:

  • Whether respondents had experienced coerced debt;
  • Which person in their life (a current or former partner, or family member) had perpetrated the behaviour that led to coerced debt; and
  • What types of debts had been coerced.

To understand whether respondents had experienced coerced debt, we asked them to select from a series of indicators, which are laid out in the ‘How we conducted this research’ section. We also asked them who had pressured them into making the transactions that led to these debts. This person is referred to as ‘the perpetrator’ in what follows.

Fig. 1: Respondents with coerced debts disaggregated by benefit status, housing tenure, work status, gender and additional vulnerability

The chart shows how our sample of adults who have experienced coerced debt was split by demographic status.

Detailed graph showing demographic status

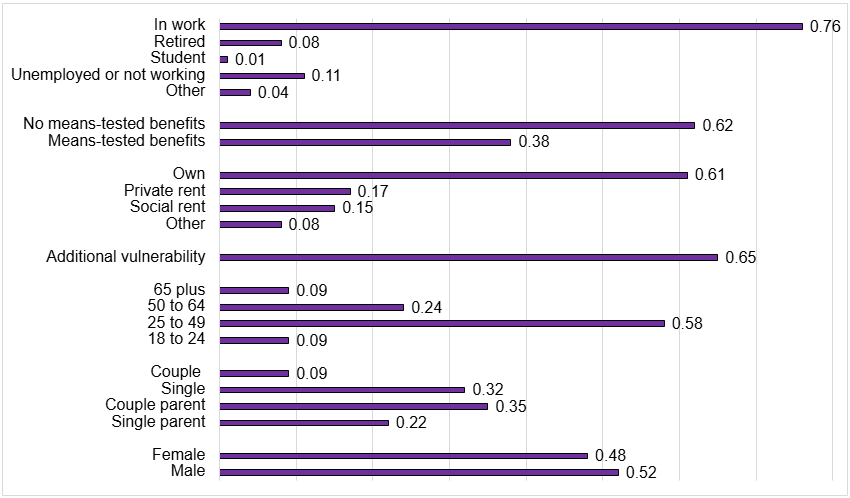
The data indicated that respondents experiencing coerced debts differed from the risk factors for domestic abuse more broadly,viii where people in vulnerable circumstances are at greater risk of harm. Among the respondents, coerced debt, while creating more severe impacts for people with additional vulnerabilities, which we go on to discuss later, appeared also to be driven by opportunity (where people have stable incomes, assets and creditworthiness), with people in full-time work, homeowners, and those with a higher income no less vulnerable to coerced debt. This may also help to explain why men seem to be as commonly affected as women in our sample.

While men and those who are financially stable experienced coerced debt, those with lower incomes were disproportionately affected, with single parents, those with children under 18 and those on means-tested benefits over-represented, which reflects wider evidence of risk factors for abuse (being female, poverty, receiving benefits).

Dependence also appears to be a factor; respondents who rely on others to help them manage their life or their money experienced coerced debt in greater numbers, which again demonstrates how opportunistic perpetrators take advantage of having greater access to a victim-survivor’s finances. This is also in keeping with evidence that people with additional vulnerabilities are more susceptible to abuse,ix as well as the abuse creating more severe effects for people with additional vulnerabilities.

Overall, the data did not reveal a strong gender split. In fact, slightly more men (52%) than women (48%) indicated that they had experienced coerced debt. Given other data we have around domestic abuse, where women are disproportionately represented among victim-survivors,x it is likely that this lack of gender divide is explained by the small sample size as well as the proportion of people who experienced coercive and controlling behaviour by a family member in our survey. Wider evidence shows that domestic abuse from non-intimate partners does not come with the same gender differences as intimate partner abuse.xi Indeed, experiences of coercive and controlling behaviour were much higher among male respondents (57%) than female respondents (33%).

Wider evidence shows that some groups like those with disabilities and Black, Asian and racially minoritised people all appear more likely to experience abuse.xii 80% of the sample identified as white British and 19% as a non-white British ethnicity, but we aren’t able to draw conclusions on prevalence and how this maps onto wider trends from our data.

Fig 2: Relationship of the perpetrator to the victim-survivor (%)

This chart shows the relationship between the victim-survivor and the perpetrator. Respondents could select more than one perpetrator type, hence why the percentages do not add up to 100.

bar chart with totals: current partner (32%), ex-partner (46%), family member (46%)

The data shows an even split between those who experienced coerced debt from a family member or ex-partner, with a third (33%) having had debts taken out in their name from a current partner. However, it seems likely that those currently experiencing abuse are less likely to participate in the polling we commissioned owing to safety concerns or other factors.xii

More women than men experienced coercive and controlling behaviour by an ex-partner – 50% compared to 43%. For older people and single people without children, the perpetrator was more likely to be a family member.

Types of coerced debt

We asked respondents whether they had any outstanding debts as a result of the actions the perpetrator had taken to pressure them. More than three quarters of respondents (78%) said they had at least one outstanding debt as a direct result of these actions and over half (57%) reported having two or more outstanding debts.

Men were particularly likely to report ongoing debt as a result of the perpetrator’s behaviour. More than eight in ten men (83%) said they had at least one outstanding debt, and two thirds (67%) had more than one. Nearly three quarters of women (72%), meanwhile, reported having at least one outstanding debt linked to the perpetrator’s actions, and almost half (46%) had two or more outstanding debts.

Older people appear to be less likely to be left with debts than working age people, which may be because older people are more vulnerable to economic abuse involving their income or assets (or of other types), rather than debts that could be taken out in their name.

Fig. 3 – Types of debt taken out in respondents’ names

Debt type Percentage
Credit card debt 49%
Debt owed to family and friends 27%
Other consumer loans (such as personal loans) 23%
Interest-free buy now, pay later debts (Klarna, Clearpay etc.) 20%
Utility arrears (energy, water or telecoms, including mobile phones) 19%
Retail credit (catalogue credit or store cards) 19%
Housing (rent or mortgage arrears) 15%
Council tax arrears 13%

Figure 3 shows that the most common debt was credit card debt (49%). Debts owed to family and friends were the second most commonly cited debt type. Interest-free buy now, pay later debts were cited in a fifth of cases, which reflects how increasingly digitised and ‘frictionless’ credit products can be susceptible to abuse.xiv

While utility arrears (19%), housing arrears (15%) and council tax arrears (13%) were less common, they still represent a worrying minority because of the particularly harmful knock-on effects, such as energy disconnection, eviction proceedings and aggressive and harmful council tax enforcement.xiv So, we can see how different types of coerced debt can lead to further financial and wider harms.

Would you like to find out more?

Email us to discuss or request more information about this report at policy@stepchange.org

References on this page